Note
Go to the end to download the full example code. or to run this example in your browser via Binder
Phase Noise Effects on Signal Constellations
This example demonstrates the PhaseNoiseChannel in Kaira, which simulates phase noise commonly encountered in oscillators and frequency synthesizers. Phase noise is a critical impairment in high-frequency communication systems and can severely degrade performance even when signal amplitude remains intact.
import matplotlib.pyplot as plt
Imports and Setup
import numpy as np
import torch
from matplotlib.colors import LinearSegmentedColormap

from kaira.channels import AWGNChannel, PhaseNoiseChannel
from kaira.modulations import QAMModulator

# Set random seed for reproducibility
torch.manual_seed(42)
np.random.seed(42)
Generate QAM Constellation
We’ll use a 16-QAM constellation to demonstrate phase noise effects.
# Create a 16-QAM modulator
qam_modulator = QAMModulator(16)

# Get the constellation points
qam_constellation = qam_modulator.constellation
print(f"Generated 16-QAM constellation with {len(qam_constellation)} points")
Generated 16-QAM constellation with 16 points
Create Transmission with Multiple Phase Noise Levels
We’ll transmit the constellation through channels with increasing phase noise.
# Define phase noise levels (standard deviation in radians)
phase_std_levels = [0.0, 0.1, 0.2, 0.5]

# Create a fixed AWGN channel for comparison
awgn_channel = AWGNChannel(avg_noise_power=0.01)

# Create different phase noise channels
phase_noise_channels = []
for phase_std in phase_std_levels:
    phase_noise_channels.append((phase_std, PhaseNoiseChannel(phase_noise_std=phase_std)))
Simulate Transmission with Phase Noise
Pass our constellation points through the phase noise channels.
# Prepare input signals - repeat constellation points many times
num_symbols_per_point = 500
input_points = []

# First check the shape of the constellation
if qam_constellation.ndim == 1 or (hasattr(qam_constellation, "shape") and qam_constellation.shape[1] == 1):
    # If constellation is complex or has only one dimension
    if torch.is_complex(qam_constellation):
        # Work with complex numbers directly
        input_complex = torch.concat([point.repeat(num_symbols_per_point) for point in qam_constellation])
    else:
        # It's a 1D real tensor - convert to complex
        input_complex = torch.concat([point.repeat(num_symbols_per_point) for point in qam_constellation])
else:
    # The constellation has separate I/Q components
    for point in qam_constellation:
        # Repeat each constellation point multiple times
        repeated_point = point.repeat(num_symbols_per_point, 1)
        input_points.append(repeated_point)

    input_signal = torch.cat(input_points, dim=0)
    # Create complex tensor from the separate I/Q components
    input_complex = torch.complex(input_signal[:, 0], input_signal[:, 1])

# Pass through channels
outputs = []

for phase_std, phase_channel in phase_noise_channels:
    with torch.no_grad():
        # Apply phase noise
        output = phase_channel(input_complex)
    outputs.append((phase_std, output))
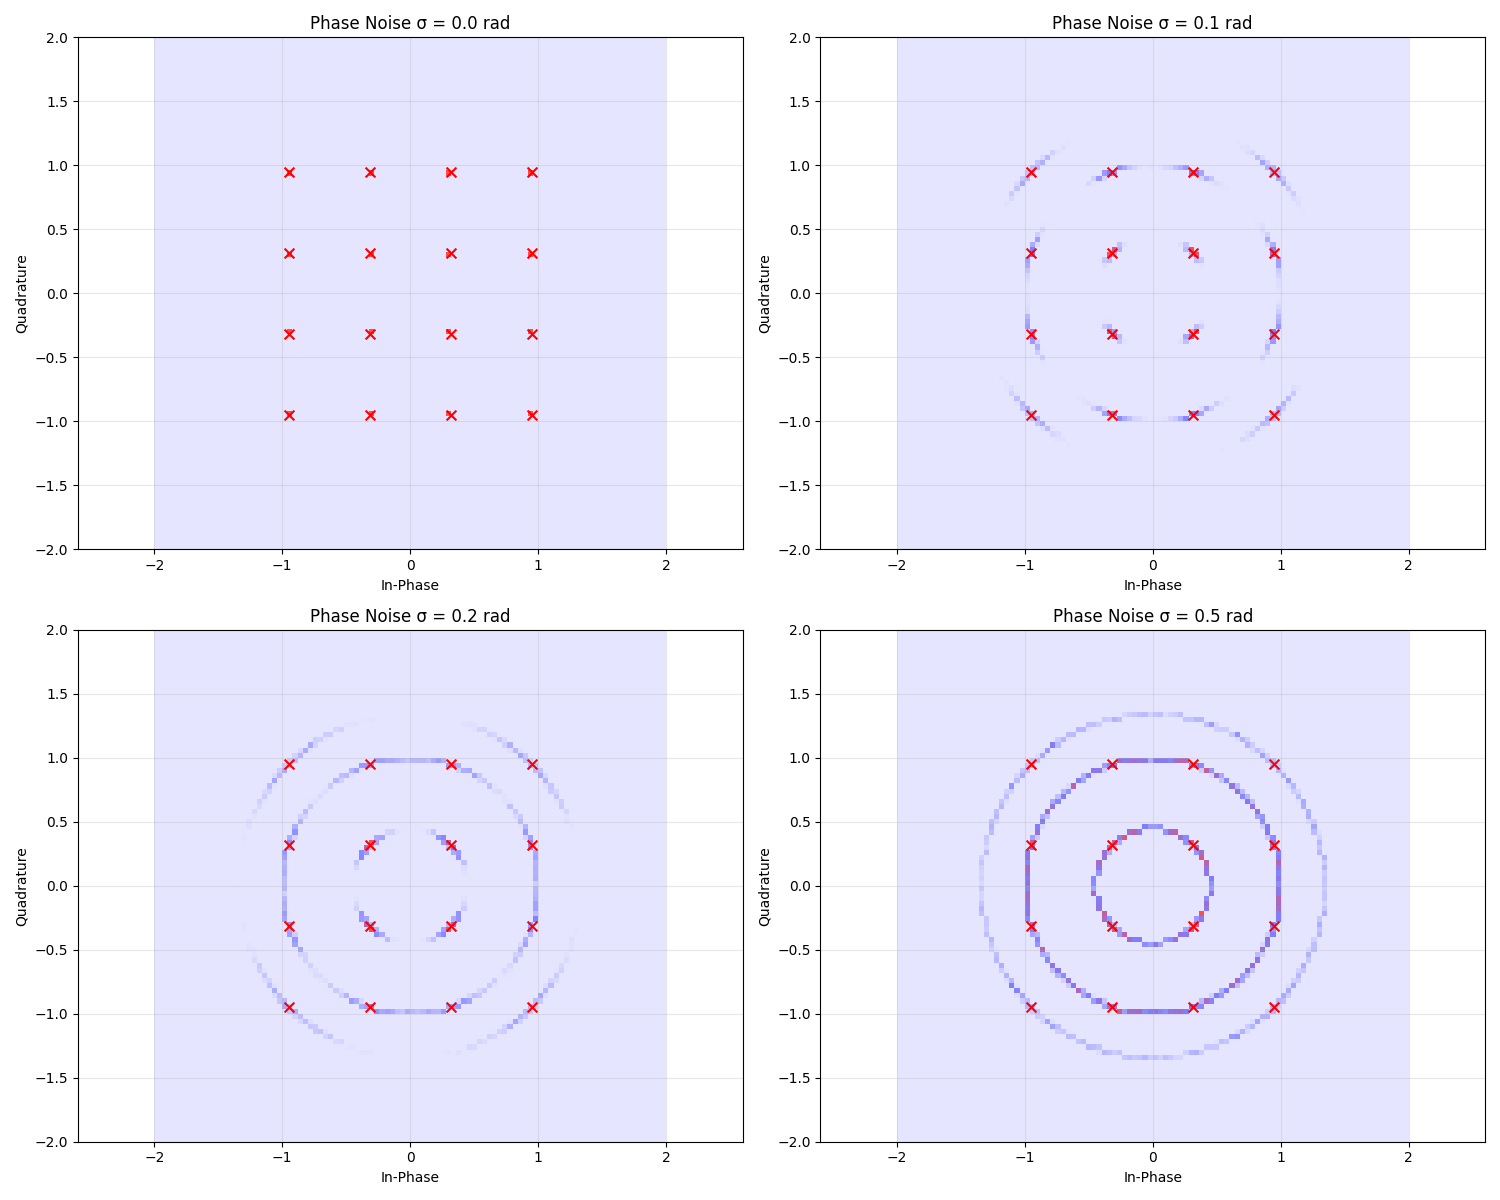
Visualize Phase Noise Effects
Let’s visualize how phase noise distorts the QAM constellation.
# Custom colormap for better visualization
colors = [(0, 0, 1, 0.1), (0, 0, 1, 0.5), (1, 0, 0, 0.7)]  # Red with high alpha for high density
cmap = LinearSegmentedColormap.from_list("density_cmap", colors)

plt.figure(figsize=(15, 12))

# Plot each constellation with different phase noise levels
for i, (phase_std, output) in enumerate(outputs):
    plt.subplot(2, 2, i + 1)

    # Get real and imaginary components for scatter plot
    x = torch.real(output).cpu().numpy()
    y = torch.imag(output).cpu().numpy()

    # Create density-based scatter plot - ensure x and y are real values
    plt.hist2d(x, y, bins=100, range=[[-2, 2], [-2, 2]], cmap=cmap)

    # Plot original constellation points for reference
    if qam_constellation.ndim == 1:  # 1D complex tensor
        orig_x = torch.real(qam_constellation).cpu().numpy()
        orig_y = torch.imag(qam_constellation).cpu().numpy()
    else:  # 2D tensor with separate I/Q components
        orig_x = qam_constellation[:, 0].cpu().numpy()
        orig_y = qam_constellation[:, 1].cpu().numpy()

    plt.scatter(orig_x, orig_y, color="red", marker="x", s=50)

    plt.title(f"Phase Noise σ = {phase_std} rad")
    plt.xlabel("In-Phase")
    plt.ylabel("Quadrature")
    plt.grid(True, alpha=0.3)
    plt.axis("equal")

plt.tight_layout()
plt.show()
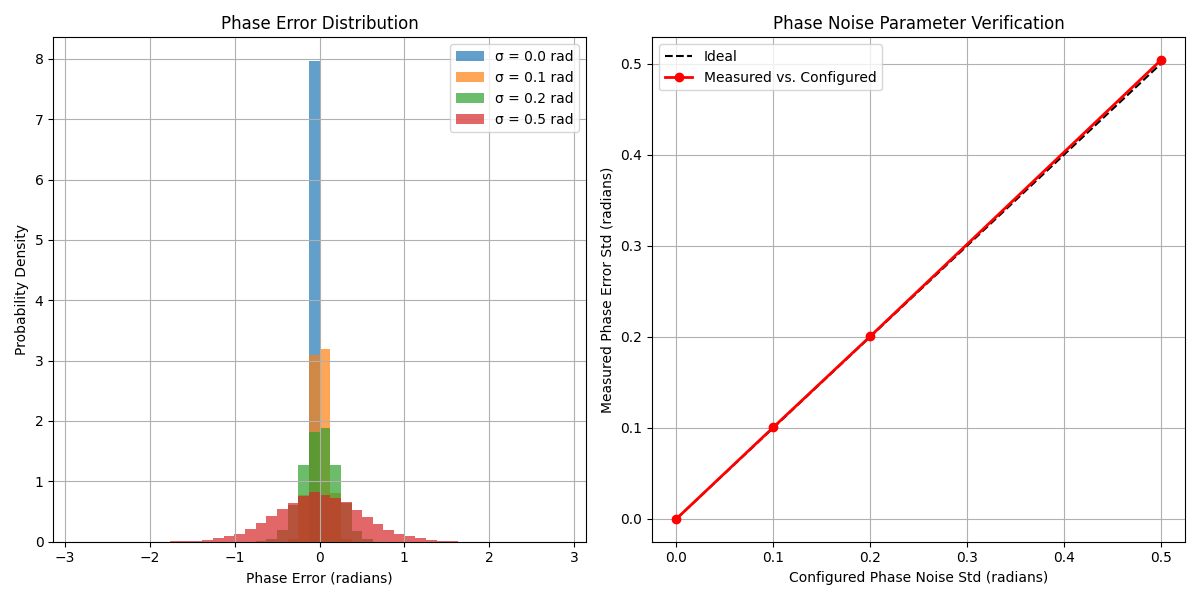
Analyze Phase Error Statistics
Let’s analyze how phase noise affects the phase error distribution.
# Calculate phase error for each point
phase_errors = []

# Reference constellation indices for each point
ref_indices = np.repeat(np.arange(len(qam_constellation)), num_symbols_per_point)

for phase_std, output in outputs:
    # Calculate original phase of constellation points
    if qam_constellation.ndim == 1:  # 1D complex tensor
        original_phases = torch.angle(qam_constellation[ref_indices])
    else:  # 2D tensor with separate I/Q components
        original_phases = torch.angle(torch.complex(qam_constellation[ref_indices, 0], qam_constellation[ref_indices, 1]))

    # Calculate received phase
    received_phases = torch.angle(output)

    # Calculate phase error (unwrapped to handle -π/π boundary)
    errors = (received_phases - original_phases).cpu().numpy()
    # Normalize errors to [-π, π]
    errors = np.mod(errors + np.pi, 2 * np.pi) - np.pi

    phase_errors.append((phase_std, errors))

# Plot phase error distributions
plt.figure(figsize=(12, 6))

# Create histogram of phase errors
plt.subplot(1, 2, 1)
for phase_std, errors in phase_errors:
    plt.hist(errors, bins=50, range=(-np.pi, np.pi), density=True, alpha=0.7, label=f"σ = {phase_std} rad")

plt.grid(True)
plt.xlim([-np.pi, np.pi])
plt.xlabel("Phase Error (radians)")
plt.ylabel("Probability Density")
plt.title("Phase Error Distribution")
plt.legend()

# Plot theoretical vs measured standard deviation
plt.subplot(1, 2, 2)
measured_std = [np.std(errors) for _, errors in phase_errors]
theoretical_std = phase_std_levels

plt.plot([0, 0.5], [0, 0.5], "k--", label="Ideal")
plt.plot(theoretical_std, measured_std, "ro-", linewidth=2, label="Measured vs. Configured")

plt.grid(True)
plt.xlabel("Configured Phase Noise Std (radians)")
plt.ylabel("Measured Phase Error Std (radians)")
plt.title("Phase Noise Parameter Verification")
plt.legend()

plt.tight_layout()
plt.show()
Symbol Error Rate Analysis
Let’s analyze how phase noise affects the symbol error rate (SER).
# Function to detect the closest constellation point
def detect_symbol(received_points, constellation):
    """Detect the closest constellation point for each received point.

    Args:
        received_points (torch.Tensor): Complex tensor containing received signal points.
        constellation (torch.Tensor): Reference constellation points, either as complex
            1D tensor or 2D tensor with separate I/Q components.

    Returns:
        torch.Tensor: Indices of the closest constellation points for each received point.
    """
    # Calculate distances to each constellation point
    distances = []
    if constellation.ndim == 1:  # 1D complex tensor
        for point in constellation:
            dist = torch.abs(received_points - point)
            distances.append(dist)
    else:  # 2D tensor with separate I/Q components
        for point in constellation:
            # Convert to complex for easier distance calculation
            point_complex = torch.complex(point[0], point[1])
            dist = torch.abs(received_points - point_complex)
            distances.append(dist)

    # Stack distances and find minimum
    distances = torch.stack(distances, dim=1)  # [num_points, num_constellation_points]
    _, min_idx = torch.min(distances, dim=1)

    return min_idx


# Calculate SER for each phase noise level
ser_results = []

for phase_std, output in outputs:
    # Detect symbols
    detected_indices = detect_symbol(output, qam_constellation)

    # Calculate errors
    errors = detected_indices != torch.from_numpy(ref_indices).to(detected_indices.device)
    ser = torch.mean(errors.float()).item()

    ser_results.append((phase_std, ser))
    print(f"Phase Noise σ = {phase_std} rad: SER = {ser:.4f}")

# Plot SER vs. phase noise level
plt.figure(figsize=(10, 6))

phase_stds = [std for std, _ in ser_results]
sers = [ser for _, ser in ser_results]

plt.semilogy(phase_stds, sers, "bo-", linewidth=2)
plt.grid(True)
plt.xlabel("Phase Noise Std (radians)")
plt.ylabel("Symbol Error Rate (SER)")
plt.title("Symbol Error Rate vs. Phase Noise")

plt.tight_layout()
plt.show()
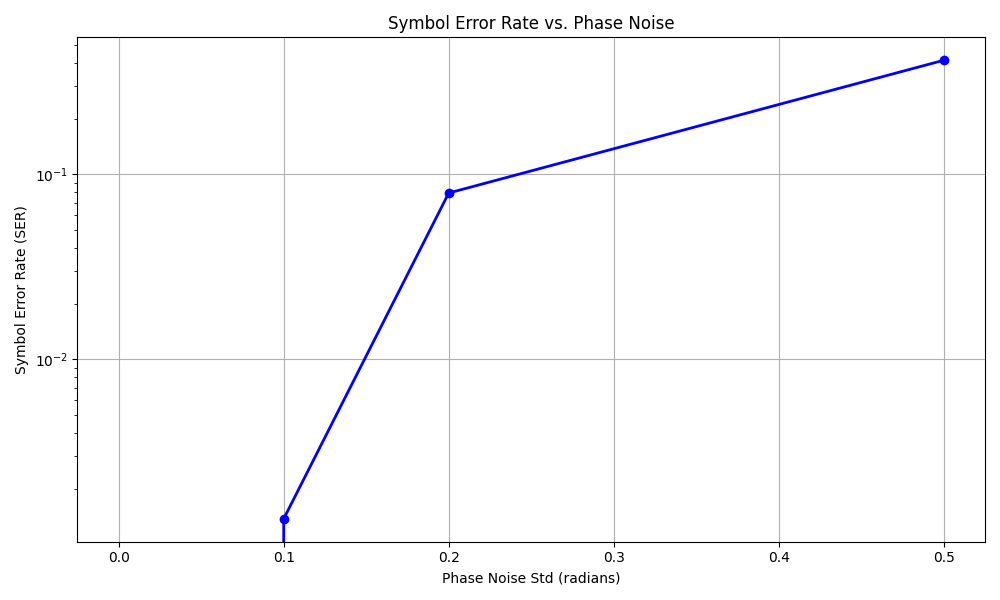
Phase Noise σ = 0.0 rad: SER = 0.0000
Phase Noise σ = 0.1 rad: SER = 0.0014
Phase Noise σ = 0.2 rad: SER = 0.0794
Phase Noise σ = 0.5 rad: SER = 0.4144
Conclusion
This example demonstrates the effect of phase noise on digital communications:
Phase noise causes constellation points to spread in a circular pattern around their original positions, rather than in all directions as with AWGN
The severity of constellation distortion increases with the phase noise standard deviation
Phase noise particularly impacts higher-order modulations (like 16-QAM shown here) because constellation points become harder to distinguish when their phases are perturbed
As phase noise increases, the symbol error rate increases dramatically, demonstrating why phase noise is a critical impairment to address in modern communication systems
The PhaseNoiseChannel in Kaira allows you to accurately model these effects when designing communications systems that need to operate in the presence of phase noise.
Total running time of the script: (0 minutes 1.026 seconds)