Note
Go to the end to download the full example code. or to run this example in your browser via Binder
Signal and Error Rate Metrics
This example demonstrates the usage of signal and error rate metrics in the Kaira library, including BER (Bit Error Rate), BLER (Block Error Rate), SER (Symbol Error Rate), FER (Frame Error Rate), and SNR (Signal-to-Noise Ratio). These metrics are essential for evaluating the performance of communication systems.
from typing import Dict, List, Literal

import numpy as np
import torch

from kaira.channels import AWGNChannel
from kaira.metrics.signal import (
    BitErrorRate,
    BlockErrorRate,
    FrameErrorRate,
    SignalToNoiseRatio,
    SymbolErrorRate,
)
from kaira.modulations import QAMDemodulator, QAMModulator
from kaira.utils import snr_to_noise_power
from kaira.utils.plotting import PlottingUtils

# Set random seed for reproducibility
torch.manual_seed(42)
np.random.seed(42)

# Configure plotting style
PlottingUtils.setup_plotting_style()
Initialize Metrics
ber_metric = BitErrorRate()  # or BER()
bler_metric = BlockErrorRate()  # or BLER()
ser_metric = SymbolErrorRate()  # or SER()
fer_metric = FrameErrorRate()  # or FER()
snr_metric = SignalToNoiseRatio()  # or SNR()
1. Basic Metric Usage
Demonstrate basic usage of each metric
# Generate random bits
n_bits = 1000
bits = torch.randint(0, 2, (1, n_bits))

# Introduce some errors
error_probability = 0.05
errors = torch.rand(1, n_bits) < error_probability
received_bits = torch.logical_xor(bits, errors).int()

# Calculate BER
ber_value = ber_metric(received_bits, bits)

print("Performance Results: Basic Error Rate Analysis")
print("=" * 46)
print(f"True error probability: {error_probability}")
print(f"Measured BER: {ber_value.item():.5f}")
Performance Results: Basic Error Rate Analysis
==============================================
True error probability: 0.05
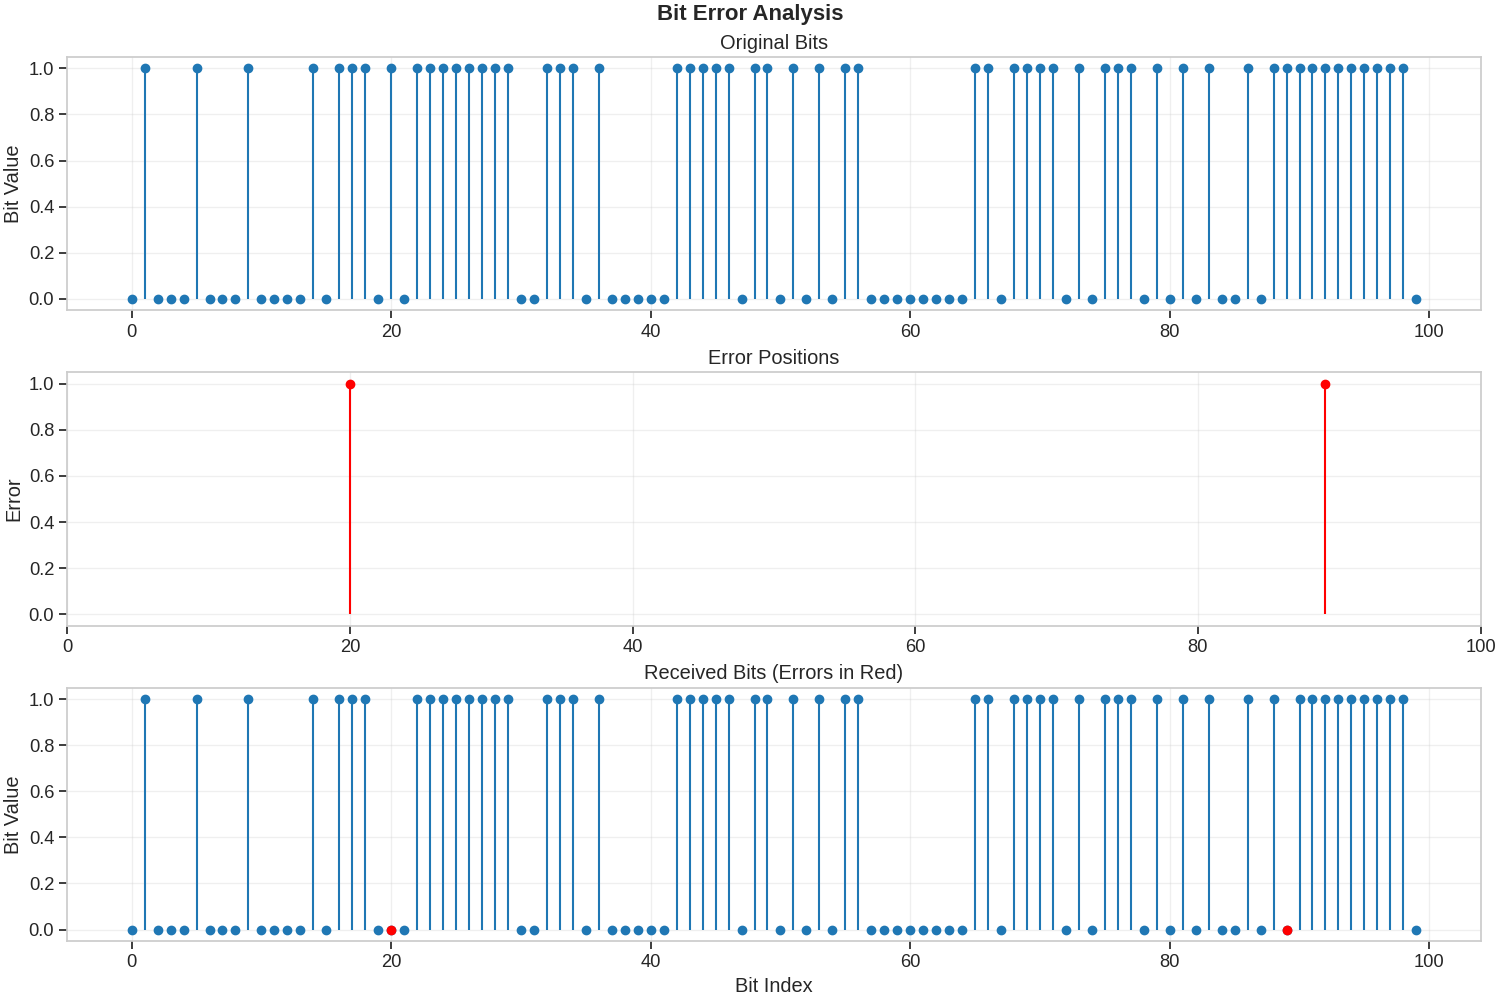
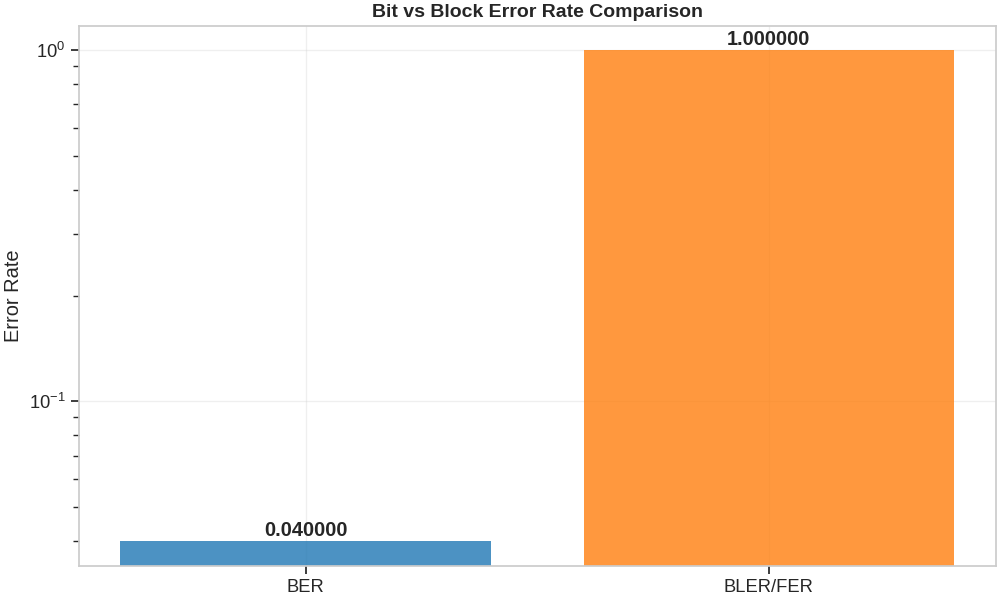
Measured BER: 0.04000
Visualize bit errors Visualization: Bit Error Locations and Patterns ================================================ Display the original bits, error locations, and received bits to understand the error distribution and pattern in the transmitted data.
fig = PlottingUtils.plot_bit_error_visualization(bits, errors, received_bits, "Bit Error Analysis")
fig.show()
2. Block Error Rate (BLER) and Frame Error Rate (FER)
Calculate BLER by reshaping bits into blocks
# Reshape bits into blocks of 10 bits each
block_size = 10
n_blocks = n_bits // block_size
block_bits = bits[:, : n_blocks * block_size].reshape(1, n_blocks, block_size)
received_block_bits = received_bits[:, : n_blocks * block_size].reshape(1, n_blocks, block_size)

# Calculate BLER (a block has an error if any bit in it has an error)
bler_value = bler_metric(received_block_bits, block_bits)

# Calculate FER (treating each block as a frame)
fer_value = fer_metric(received_block_bits, block_bits)

print("Block and Frame Error Analysis Results")
print("=" * 38)
print(f"Block Error Rate: {bler_value.item():.5f}")
print(f"Frame Error Rate: {fer_value.item():.5f}")  # For this example, FER and BLER are the same
Block and Frame Error Analysis Results
======================================
Block Error Rate: 1.00000
Frame Error Rate: 1.00000
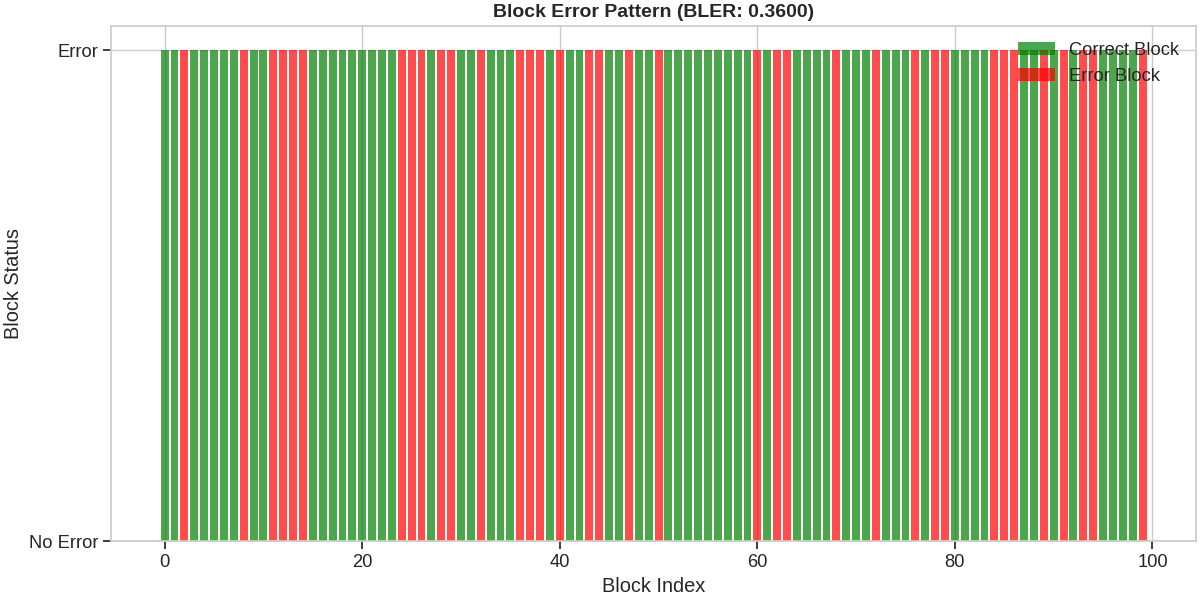
Visualize the difference between bit errors and block errors Block-Level Error Analysis ========================== Compare bit-level errors (BER) with block-level errors (BLER/FER) to understand how individual bit errors propagate to block failures.
# Actually count the blocks with errors for visualization
blocks_with_errors = torch.any(torch.logical_xor(block_bits, received_block_bits), dim=-1).int()
block_error_rate = blocks_with_errors.float().mean().item()

# Create error rate comparison
metrics_comparison = {"BER": ber_value.item(), "BLER/FER": bler_value.item()}
fig1 = PlottingUtils.plot_error_rate_comparison(metrics_comparison, "Bit vs Block Error Rate Comparison")
fig1.show()

# Visualize block error pattern
fig2 = PlottingUtils.plot_block_error_visualization(blocks_with_errors, block_error_rate, "Block Error Pattern")
fig2.show()
3. Symbol Error Rate (SER) with QAM Modulation
Demonstrate SER using 16-QAM modulation
# Create QAM modulator and demodulator
qam_order: Literal[4, 16, 64, 256] = 16
bits_per_symbol = int(np.log2(qam_order))
modulator = QAMModulator(order=qam_order)
demodulator = QAMDemodulator(order=qam_order)

# Generate random bits for QAM
n_symbols = 1000
n_bits_qam = n_symbols * bits_per_symbol
qam_bits = torch.randint(0, 2, (1, n_bits_qam))

# Modulate
qam_symbols = modulator(qam_bits)

# Add noise (simulating channel effects)
noise_power = 0.05
noise = torch.sqrt(torch.tensor(noise_power)) * torch.randn_like(qam_symbols)
received_symbols = qam_symbols + noise

# Demodulate
received_bits = demodulator(received_symbols)

# Calculate BER
qam_ber = ber_metric(received_bits, qam_bits)

# Calculate SER (reshape bits to calculate symbol errors)
# A symbol has an error if any of its bits are wrong
symbol_bits = qam_bits.reshape(1, n_symbols, bits_per_symbol)
received_symbol_bits = received_bits.reshape(1, n_symbols, bits_per_symbol)
qam_ser = ser_metric(received_symbol_bits, symbol_bits)

print("QAM Modulation Performance Results")
print("=" * 34)
print(f"16-QAM BER: {qam_ber.item():.5f}")
print(f"16-QAM SER: {qam_ser.item():.5f}")
QAM Modulation Performance Results
==================================
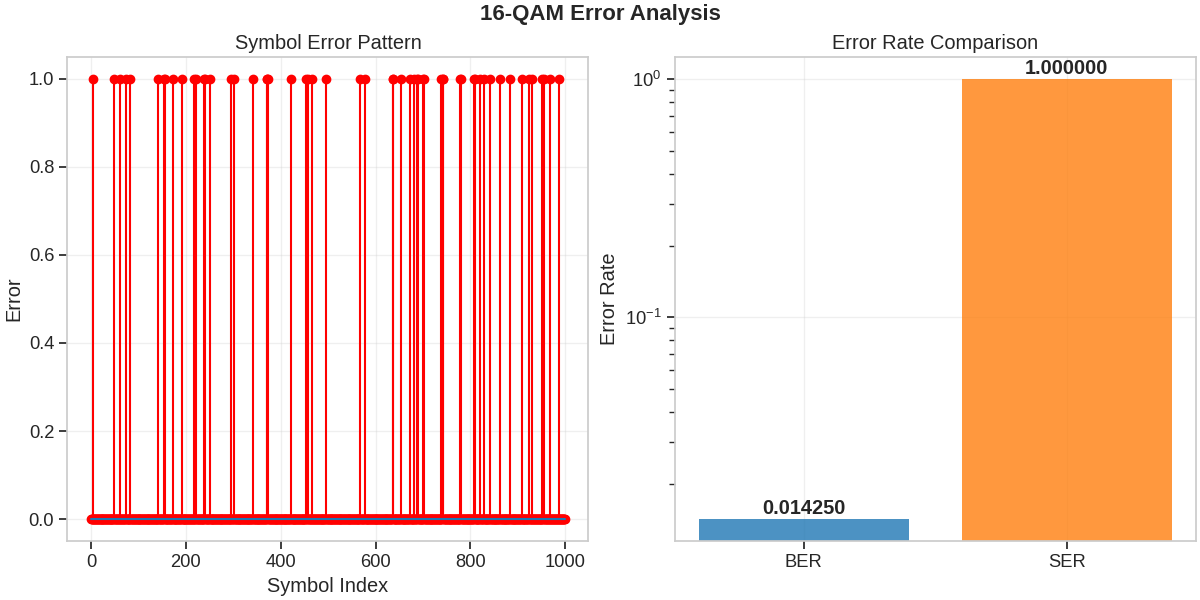
16-QAM BER: 0.01425
16-QAM SER: 1.00000
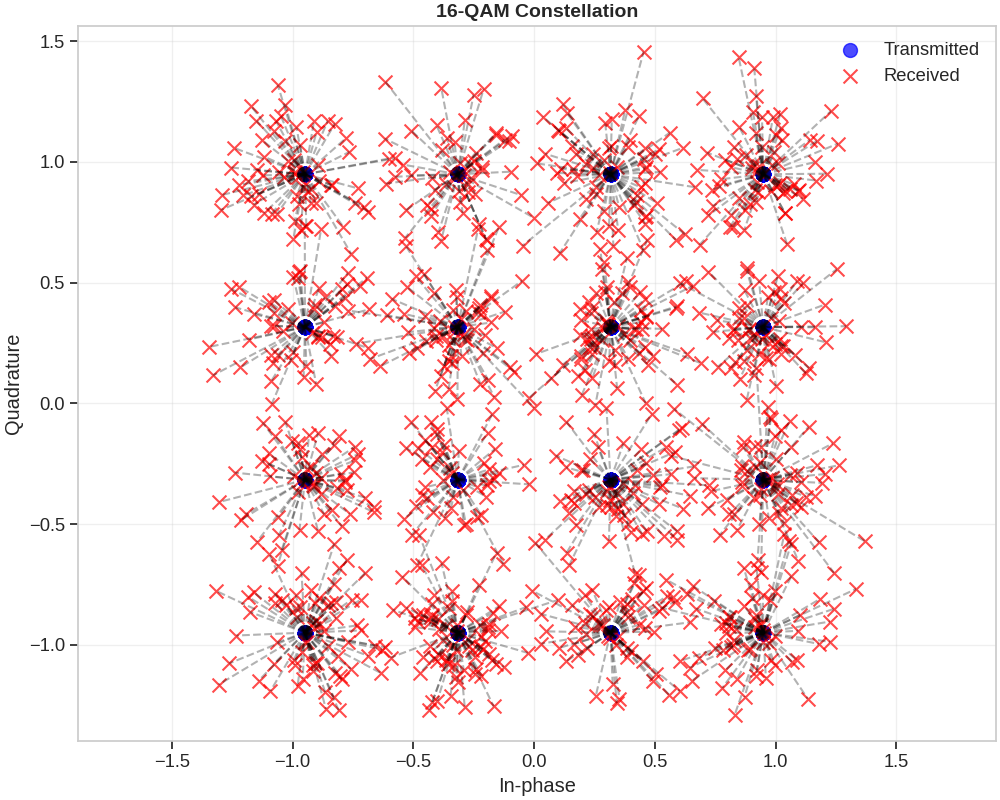
Visualize QAM constellation and received symbols QAM Constellation and Symbol Error Analysis =========================================== Display the QAM constellation diagram showing transmitted vs received symbols, and analyze the relationship between symbol errors and bit errors.
# Calculate symbol error mask for visualization
error_mask = torch.any(torch.logical_xor(symbol_bits, received_symbol_bits), dim=-1).int()

# Create constellation plot with errors
fig1 = PlottingUtils.plot_qam_constellation_with_errors(qam_symbols, received_symbols, "16-QAM Constellation")
fig1.show()

# Analyze symbol vs bit error rates
fig2 = PlottingUtils.plot_symbol_error_analysis(error_mask, qam_ber.item(), qam_ser.item(), "16-QAM Error Analysis")
fig2.show()
4. Evaluating Communication System Performance
Evaluate BER and SER over different SNR values
# SNR range in dB
snr_db_range = np.arange(0, 21, 2)
qam_orders: List[Literal[4, 16, 64]] = [4, 16, 64]

# Store results
ber_results: Dict[Literal[4, 16, 64], List[float]] = {order: [] for order in qam_orders}
ser_results: Dict[Literal[4, 16, 64], List[float]] = {order: [] for order in qam_orders}
measured_snr: Dict[Literal[4, 16, 64], List[float]] = {order: [] for order in qam_orders}

# Define parameters
n_symbols = 10000

for qam_order in qam_orders:
    bits_per_symbol = int(np.log2(qam_order))
    modulator = QAMModulator(order=qam_order)
    demodulator = QAMDemodulator(order=qam_order)

    # Generate random bits
    n_bits_qam = n_symbols * bits_per_symbol
    qam_bits = torch.randint(0, 2, (1, n_bits_qam))

    # Modulate
    qam_symbols = modulator(qam_bits)

    for snr_db in snr_db_range:
        # Calculate noise power from SNR
        noise_power = snr_to_noise_power(1.0, snr_db)  # Assuming average signal power of 1.0

        # Create channel
        channel = AWGNChannel(avg_noise_power=noise_power)

        # Transmit through channel
        received_symbols = channel(qam_symbols)

        # Measure SNR
        actual_snr = snr_metric(received_symbols, qam_symbols).item()
        measured_snr[qam_order].append(actual_snr)

        # Demodulate
        received_bits = demodulator(received_symbols)

        # Calculate BER
        ber = ber_metric(received_bits, qam_bits).item()
        ber_results[qam_order].append(ber)

        # Calculate SER
        symbol_bits = qam_bits.reshape(1, n_symbols, bits_per_symbol)
        received_symbol_bits = received_bits.reshape(1, n_symbols, bits_per_symbol)
        ser = ser_metric(received_symbol_bits, symbol_bits).item()
        ser_results[qam_order].append(ser)
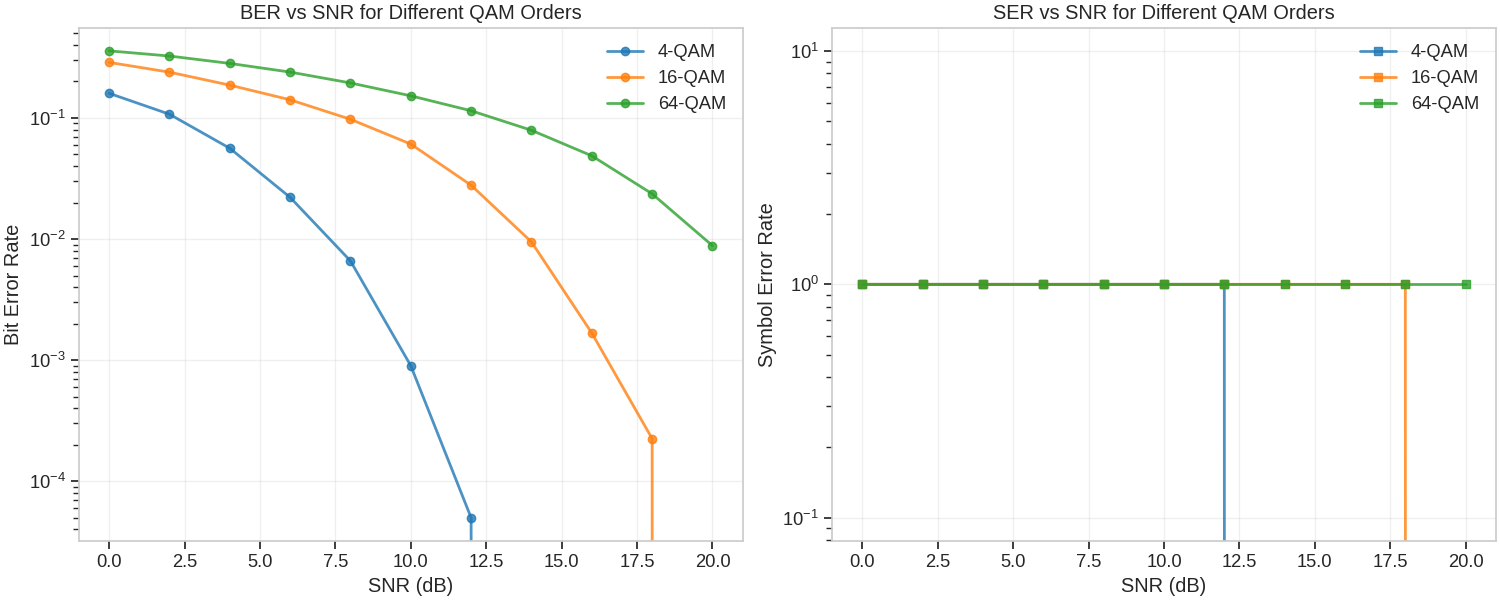
Plot BER vs SNR Multi-Order QAM Performance Analysis ==================================== Compare BER and SER performance across different QAM modulation orders to understand the trade-off between spectral efficiency and error rates.
# Convert the results to the expected format for PlottingUtils
ber_results_for_plot = {f"{order}-QAM": np.array(ber_results[order]) for order in qam_orders}
ser_results_for_plot = {f"{order}-QAM": np.array(ser_results[order]) for order in qam_orders}

fig = PlottingUtils.plot_multi_qam_ber_performance(np.array(snr_db_range), ber_results_for_plot, ser_results_for_plot, qam_orders)
fig.show()
5. Block Error Rate vs SNR
Analyze how block size affects BLER
block_sizes = [10, 50, 100]
qam_order_bler: Literal[4, 16, 64, 256] = 16
bits_per_symbol = int(np.log2(qam_order_bler))
bler_vs_snr: Dict[int, List[float]] = {block_size: [] for block_size in block_sizes}

# Create modulator/demodulator
modulator = QAMModulator(order=qam_order_bler)
demodulator = QAMDemodulator(order=qam_order_bler)

# Generate random bits (use more bits for larger block sizes)
n_symbols = 10000
n_bits_qam = n_symbols * bits_per_symbol
qam_bits = torch.randint(0, 2, (1, n_bits_qam))

# Modulate
qam_symbols = modulator(qam_bits)

for snr_db in snr_db_range:
    # Calculate noise power from SNR
    noise_power = snr_to_noise_power(1.0, snr_db)

    # Create channel
    channel = AWGNChannel(avg_noise_power=noise_power)

    # Transmit through channel
    received_symbols = channel(qam_symbols)

    # Demodulate
    received_bits = demodulator(received_symbols)

    # Calculate BLER for different block sizes
    for block_size in block_sizes:
        usable_bits = (n_bits_qam // block_size) * block_size
        blocks = qam_bits[:, :usable_bits].reshape(1, -1, block_size)
        received_blocks = received_bits[:, :usable_bits].reshape(1, -1, block_size)

        bler = bler_metric(received_blocks, blocks).item()
        bler_vs_snr[block_size].append(bler)
Plot BLER vs SNR for different block sizes Block Size Impact on Error Rates ================================ Analyze how block size affects BLER to understand the relationship between block length and error probability in communication systems.
# Convert the results to the expected format for PlottingUtils
bler_data_for_plot = {f"Block Size {size}": np.array(bler_vs_snr[size]) for size in block_sizes}

fig = PlottingUtils.plot_bler_vs_snr_analysis(np.array(snr_db_range), bler_data_for_plot, block_sizes)
fig.show()

6. Comparing Multiple Metrics on the Same System
Compare BER, BLER, SER, and FER on a 16-QAM system
# Setup parameters
qam_order_multi: Literal[4, 16, 64, 256] = 16
bits_per_symbol = int(np.log2(qam_order_multi))
block_size = 20  # bits per block
frame_size = 100  # bits per frame

# Create modulator/demodulator
modulator = QAMModulator(order=qam_order_multi)
demodulator = QAMDemodulator(order=qam_order_multi)

# Generate random bits
n_symbols = 10000
n_bits = n_symbols * bits_per_symbol
bits = torch.randint(0, 2, (1, n_bits))

# Modulate
symbols = modulator(bits)

# Store results
metrics: Dict[str, List[float]] = {"BER": [], "SER": [], "BLER": [], "FER": []}

for snr_db in snr_db_range:
    # Calculate noise power from SNR
    noise_power = snr_to_noise_power(1.0, snr_db)

    # Create channel
    channel = AWGNChannel(avg_noise_power=noise_power)

    # Transmit through channel
    received_symbols = channel(symbols)

    # Demodulate
    received_bits = demodulator(received_symbols)

    # Calculate BER
    ber = ber_metric(received_bits, bits).item()
    metrics["BER"].append(ber)

    # Calculate SER
    # Reshape bits to calculate symbol errors
    usable_bits_ser = (n_bits // bits_per_symbol) * bits_per_symbol
    symbol_bits = bits[:, :usable_bits_ser].reshape(1, -1, bits_per_symbol)
    received_symbol_bits = received_bits[:, :usable_bits_ser].reshape(1, -1, bits_per_symbol)
    ser = ser_metric(received_symbol_bits, symbol_bits).item()
    metrics["SER"].append(ser)

    # Calculate BLER
    usable_bits_bler = (n_bits // block_size) * block_size
    blocks = bits[:, :usable_bits_bler].reshape(1, -1, block_size)
    received_blocks = received_bits[:, :usable_bits_bler].reshape(1, -1, block_size)
    bler = bler_metric(received_blocks, blocks).item()
    metrics["BLER"].append(bler)

    # Calculate FER
    usable_bits_fer = (n_bits // frame_size) * frame_size
    frames = bits[:, :usable_bits_fer].reshape(1, -1, frame_size)
    received_frames = received_bits[:, :usable_bits_fer].reshape(1, -1, frame_size)
    fer = fer_metric(received_frames, frames).item()
    metrics["FER"].append(fer)
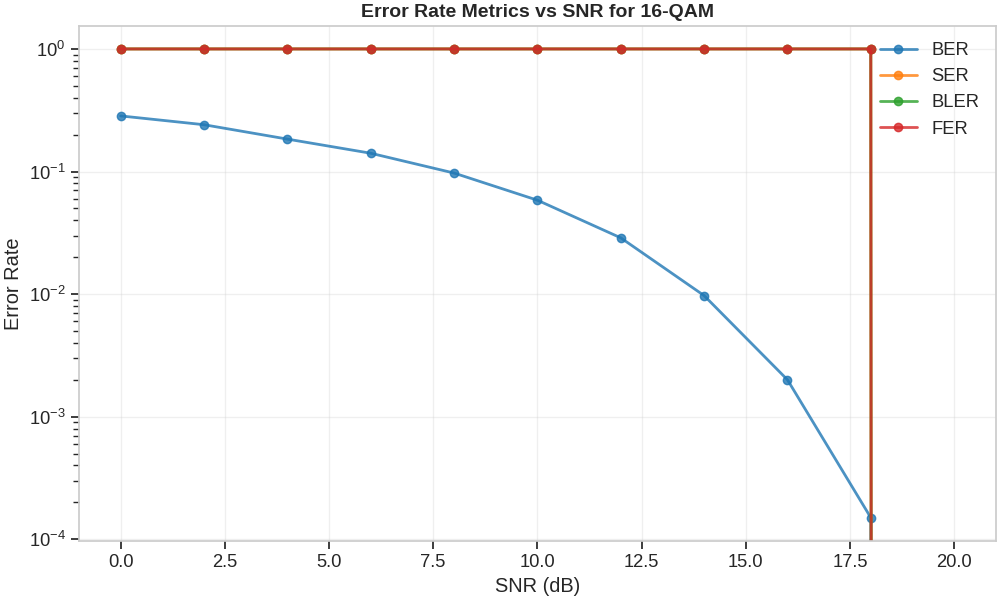
Plot all metrics together Comprehensive Error Rate Metrics Comparison =========================================== Compare BER, BLER, SER, and FER on the same system to understand the relationship between different error rate metrics in practice.
# Convert the metrics to numpy arrays for PlottingUtils
metrics_for_plot = {metric_name: np.array(values) for metric_name, values in metrics.items()}

fig = PlottingUtils.plot_multiple_metrics_comparison(np.array(snr_db_range), metrics_for_plot, "Error Rate Metrics vs SNR for 16-QAM")
fig.show()
Conclusion
This example demonstrated:
Implementation and usage of various error rate metrics in Kaira
The relationship between different error metrics (BER, SER, BLER, FER)
How modulation order affects error rates
The impact of block size on BLER
Performance evaluation of communication systems using multiple metrics
Key observations:
Higher-order QAM schemes are more susceptible to noise, requiring higher SNR
SER is always equal to or higher than BER
Larger block sizes increase the probability of block errors at a given SNR
For coding and system design, different metrics are relevant at different stages
BLER and FER are critical for evaluating the performance of coded systems
Total running time of the script: (0 minutes 2.879 seconds)
