Note
Go to the end to download the full example code. or to run this example in your browser via Binder
Benchmark Comparison Example
This example demonstrates how to use the Kaira benchmarking system to compare the performance of different approaches, such as various modulation schemes, using parameter sweeps and result visualization.
The comparison framework allows you to:
Compare multiple algorithms or configurations side-by-side
Run parameter sweeps to explore performance across different settings
Visualize comparative results with unified plotting
Generate comprehensive performance summaries
Setting up the Environment
First, let’s import the necessary modules for benchmark comparison.
import matplotlib.pyplot as plt
import numpy as np

from kaira.benchmarks import BenchmarkConfig, ComparisonRunner, create_benchmark

# Set random seed for reproducibility
np.random.seed(42)
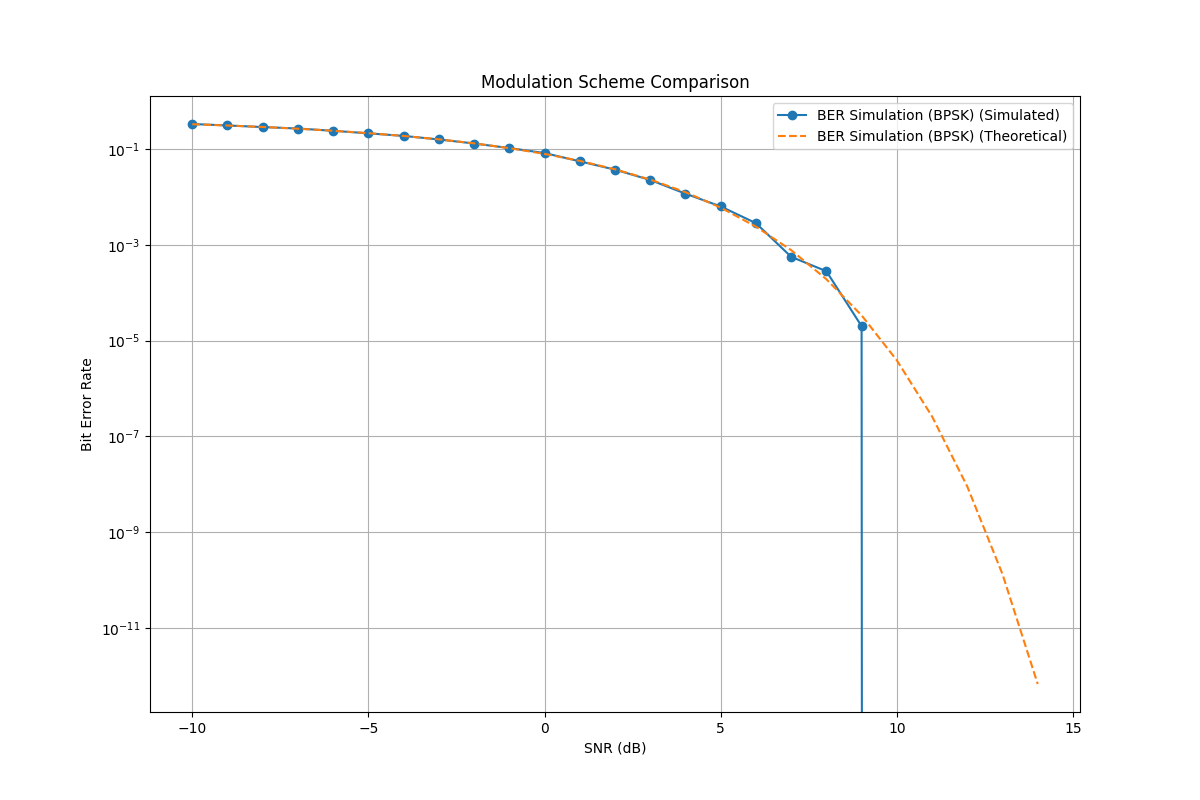
Comparing Modulation Schemes
Let’s compare the BER performance of different modulation schemes to see how they perform under various SNR conditions.
def compare_modulation_schemes():
    """Compare BER performance of different modulation schemes."""
    print("Comparing Modulation Schemes...")

    # Create benchmarks for different modulation schemes
    bpsk_benchmark = create_benchmark("ber_simulation", modulation="bpsk")

    # For this example, we'll just use BPSK, but in a real implementation
    # you would have multiple modulation schemes
    benchmarks = [bpsk_benchmark]

    # Configure comparison - use block_length instead of num_bits
    config = BenchmarkConfig(name="modulation_comparison", snr_range=list(range(-10, 11)), block_length=50000, verbose=True)

    # Run comparison with num_bits as runtime parameter
    runner = ComparisonRunner(verbose=True)
    results = runner.run_comparison(benchmarks, "Modulation Scheme Comparison", num_bits=50000, **config.to_dict())

    # Get comparison summary
    summary = runner.get_comparison_summary("Modulation Scheme Comparison")

    print("\nComparison Summary:")
    print(f"Benchmarks compared: {', '.join(summary['benchmarks'])}")
    for name, time in summary["execution_times"].items():
        print(f"  {name}: {time:.2f}s")

    # Plot comparison results
    plt.figure(figsize=(12, 8))

    for name, result in results.items():
        plt.semilogy(result.metrics["snr_range"], result.metrics["ber_simulated"], "o-", label=f"{name} (Simulated)")
        plt.semilogy(result.metrics["snr_range"], result.metrics["ber_theoretical"], "--", label=f"{name} (Theoretical)")

    plt.xlabel("SNR (dB)")
    plt.ylabel("Bit Error Rate")
    plt.title("Modulation Scheme Comparison")
    plt.legend()
    plt.grid(True)
    plt.show()

    return results
Parameter Sweep Functionality
Parameter sweeps allow you to explore how benchmark performance varies across different parameter combinations.
def parameter_sweep_example():
    """Demonstrate parameter sweep functionality."""
    print("\nRunning Parameter Sweep Example...")

    from kaira.benchmarks.runners import ParametricRunner

    # Create benchmark
    ber_benchmark = create_benchmark("ber_simulation", modulation="bpsk")

    # Define parameter grid
    parameter_grid = {"num_bits": [10000, 50000, 100000], "snr_range": [list(range(-5, 6)), list(range(-10, 11)), list(range(-15, 16))]}

    # Run parameter sweep
    runner = ParametricRunner(verbose=True)
    sweep_results = runner.run_parameter_sweep(ber_benchmark, parameter_grid)

    print("\nParameter Sweep Completed!")
    print(f"Total configurations tested: {len(list(sweep_results.values())[0])}")

    return sweep_results
Running the Complete Comparison Example
Let’s execute both comparison functions and display the results.
if __name__ == "__main__":
    print("Benchmark Comparison Example")
    print("=" * 40)

    # Run modulation scheme comparison
    print("\n1. Comparing Modulation Schemes...")
    comparison_results = compare_modulation_schemes()

    # Run parameter sweep
    print("\n2. Running Parameter Sweep...")
    sweep_results = parameter_sweep_example()

    print("\n" + "=" * 40)
    print("All comparison examples completed!")
    print("=" * 40)
Benchmark Comparison Example
========================================

1. Comparing Modulation Schemes...
Comparing Modulation Schemes...
Running comparison: Modulation Scheme Comparison
  Comparing 1 benchmarks
  Running: BER Simulation (BPSK)
    ✓ Completed in 0.02s

Comparison Summary:
Benchmarks compared: BER Simulation (BPSK)
  BER Simulation (BPSK): 0.02s

2. Running Parameter Sweep...

Running Parameter Sweep Example...
Running parameter sweep for: BER Simulation (BPSK)
  9 parameter combinations
  [1/9] {'num_bits': 10000, 'snr_range': [-5, -4, -3, -2, -1, 0, 1, 2, 3, 4, 5]}
  [2/9] {'num_bits': 10000, 'snr_range': [-10, -9, -8, -7, -6, -5, -4, -3, -2, -1, 0, 1, 2, 3, 4, 5, 6, 7, 8, 9, 10]}
  [3/9] {'num_bits': 10000, 'snr_range': [-15, -14, -13, -12, -11, -10, -9, -8, -7, -6, -5, -4, -3, -2, -1, 0, 1, 2, 3, 4, 5, 6, 7, 8, 9, 10, 11, 12, 13, 14, 15]}
  [4/9] {'num_bits': 50000, 'snr_range': [-5, -4, -3, -2, -1, 0, 1, 2, 3, 4, 5]}
  [5/9] {'num_bits': 50000, 'snr_range': [-10, -9, -8, -7, -6, -5, -4, -3, -2, -1, 0, 1, 2, 3, 4, 5, 6, 7, 8, 9, 10]}
  [6/9] {'num_bits': 50000, 'snr_range': [-15, -14, -13, -12, -11, -10, -9, -8, -7, -6, -5, -4, -3, -2, -1, 0, 1, 2, 3, 4, 5, 6, 7, 8, 9, 10, 11, 12, 13, 14, 15]}
  [7/9] {'num_bits': 100000, 'snr_range': [-5, -4, -3, -2, -1, 0, 1, 2, 3, 4, 5]}
  [8/9] {'num_bits': 100000, 'snr_range': [-10, -9, -8, -7, -6, -5, -4, -3, -2, -1, 0, 1, 2, 3, 4, 5, 6, 7, 8, 9, 10]}
  [9/9] {'num_bits': 100000, 'snr_range': [-15, -14, -13, -12, -11, -10, -9, -8, -7, -6, -5, -4, -3, -2, -1, 0, 1, 2, 3, 4, 5, 6, 7, 8, 9, 10, 11, 12, 13, 14, 15]}

Parameter Sweep Completed!
Total configurations tested: 9

========================================
All comparison examples completed!
========================================
Summary
This example showcased the comparison capabilities of the Kaira benchmarking system:
Side-by-side Comparisons: Running multiple benchmarks with the same configuration
Parameter Sweeps: Exploring performance across different parameter combinations
Visualization: Creating comparative plots to understand relative performance
Summary Statistics: Generating execution time and performance summaries
These tools are essential for making informed decisions about algorithm selection and parameter optimization in communication systems.